| Reference | Method | Variable | Inputs | Time | Horizon | Hierarchical | Level | Probabilistic | Metric |
|---|---|---|---|---|---|---|---|---|---|
| Chiu et al. (2008) | ARIMA, BPNN, ARIMAT | Total annual vaccine demand | Historical births, doses, wastage, CDC rules | Annual | 1 year | Yes | Regional | No | Average error rate |
| Kotagiri et al. (2011) | Birth pop.-based model | Births | Early birth info | NA | NA | No | Local | No | Impact on vaccine inventory levels |
| Mueller et al. (2016) | Pop.-based model | Quantity of vaccines needed | Scaled census cohort data | Monthly | 12 months | Yes | Local | No | Vaccine availability, Missed Vaccination Opportunities (MVO) |
| Azadi et al. (2018) | Regression models | Childhood immunization demand | Population size, poverty, literacy, clinics | Monthly | NA | No | Regional | No | Not available |
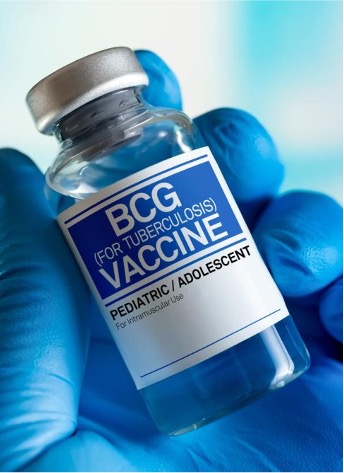
| Cernuschi et al. (2018) | Pop.-based model | BCG vaccine demand | UNPD forecast, EPI schedule, WHO coverage/wastage | Annual | 14 years | No | National | No | Comparison with historical procurement |
| Alegado & Tumibay (2020) | ARIMA, MLPNN | BCG vaccine demand | Monthly vaccination data | Monthly | 12 months | No | Local | No | RMSE, MAE |
| Colrain et al. (2020) | Stat./Probabilistic (Binomial) | Expected doses used/wastage | Birth cohort, sessions, vials, discard time | Annual | 1 year | Yes | Local | Yes | Wastage rate comparison, sensitivity analysis |
| Hariharan et al. (2020) | RFR | Vaccine utilization | Health facility data, date parts, rolling avg. | Biweekly | NA | No | Local | No | Forecasting error (FE), RMSE |
| Sahisnu et al. (2020) | ARIMA | Vaccine stock levels | Stock history data | Monthly | 10 months | No | Local | No | MAPE |
| Vinitha et al. (2024) | LR, RF, GBM, SVR, LSTM, ANN | Infant vaccination demand | Vaccine name, district, intake date | Monthly | NA | No | Local | No | RMSE, R-Square |
Outline
- Immunisation Supply Chain
- (Forecasting) Problem
- Methodology
- Model Performance Evaluation
- Way Forward
Background
- 1 in 5 children worldwide lack access to lifesaving vaccines.
- Globally, in 2023, 14.5 million children were zero-dose.
- An additional 6.5 million children are partially vaccinated.
- Annually, 1.5 million children under five die from vaccine-preventable diseases.
source: WHO
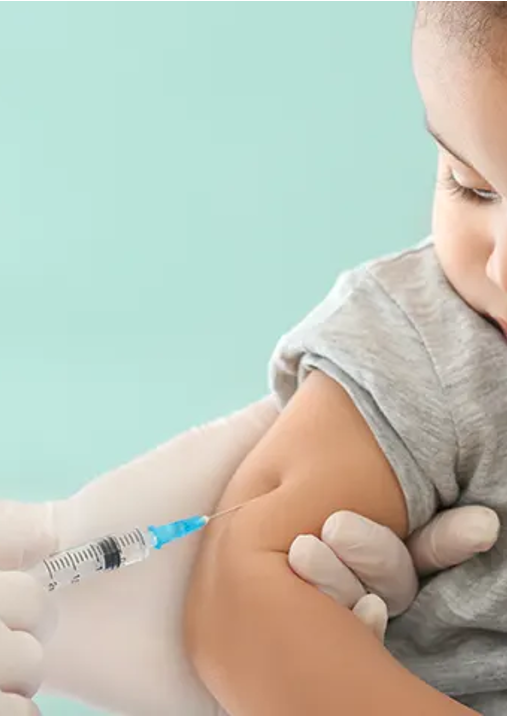
What is Routine Immunisation?
- Regular administration of vaccines for infants, children, and adults
- Builds population immunity and prevents disease
- Immunisation at birth is critical
- Newborns are highly vulnerable to severe infections
- Delays can lead to serious illness or death
- Newborns are highly vulnerable to severe infections
Most Countries Recommended Vaccine Schedule
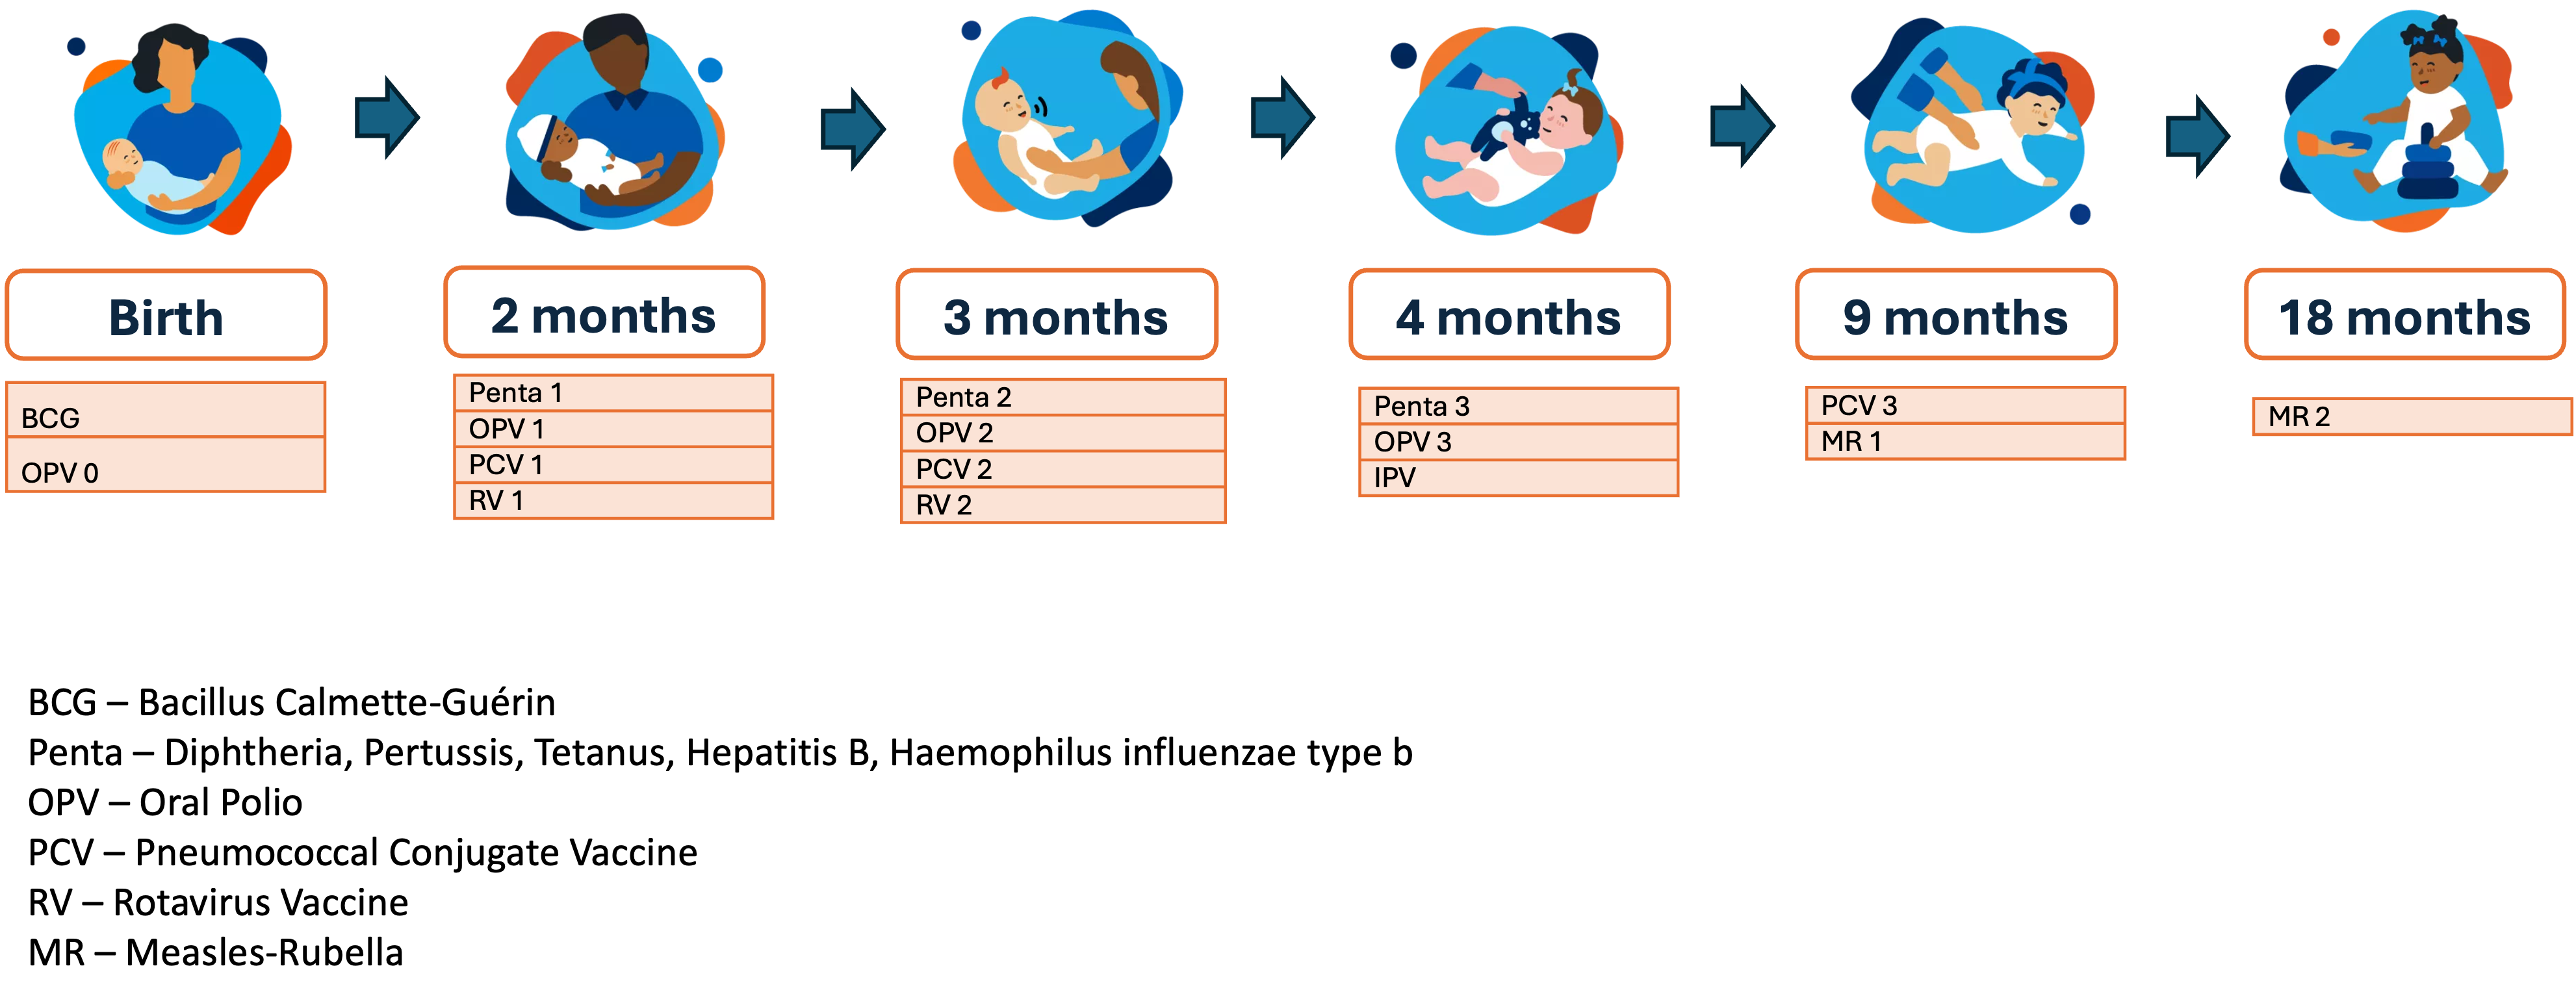
source: CDC

Why Routine Immunisation
- Solving the problem at the start:
- Fewer vaccine-preventable deaths.
- Lower immediate and long-term costs from illness and complications.
- Reduces future social and economic burden.
- Each dollar spent on immunization saves $52 in low- and middle-income countries (source: CDC)
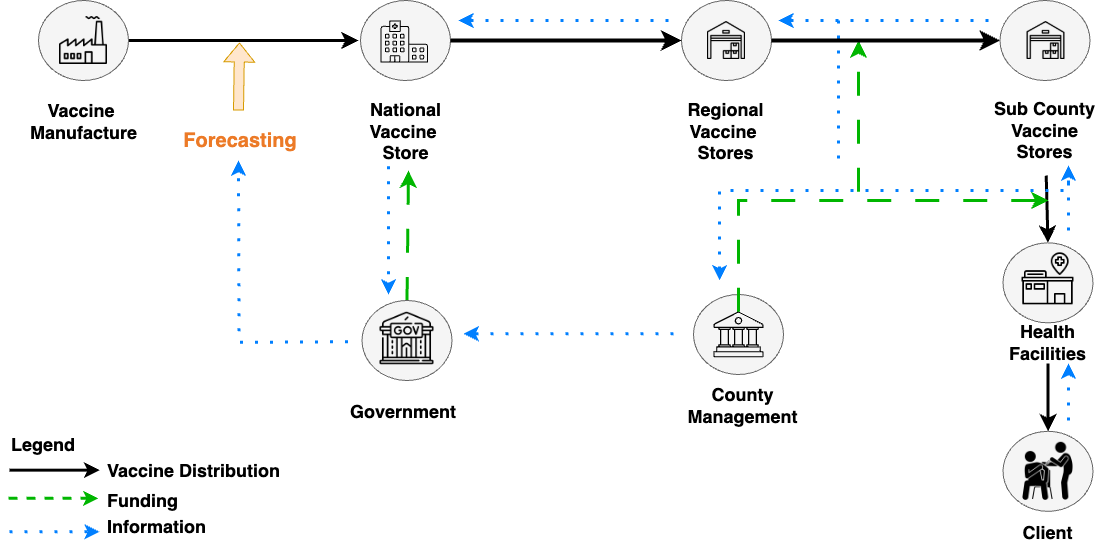
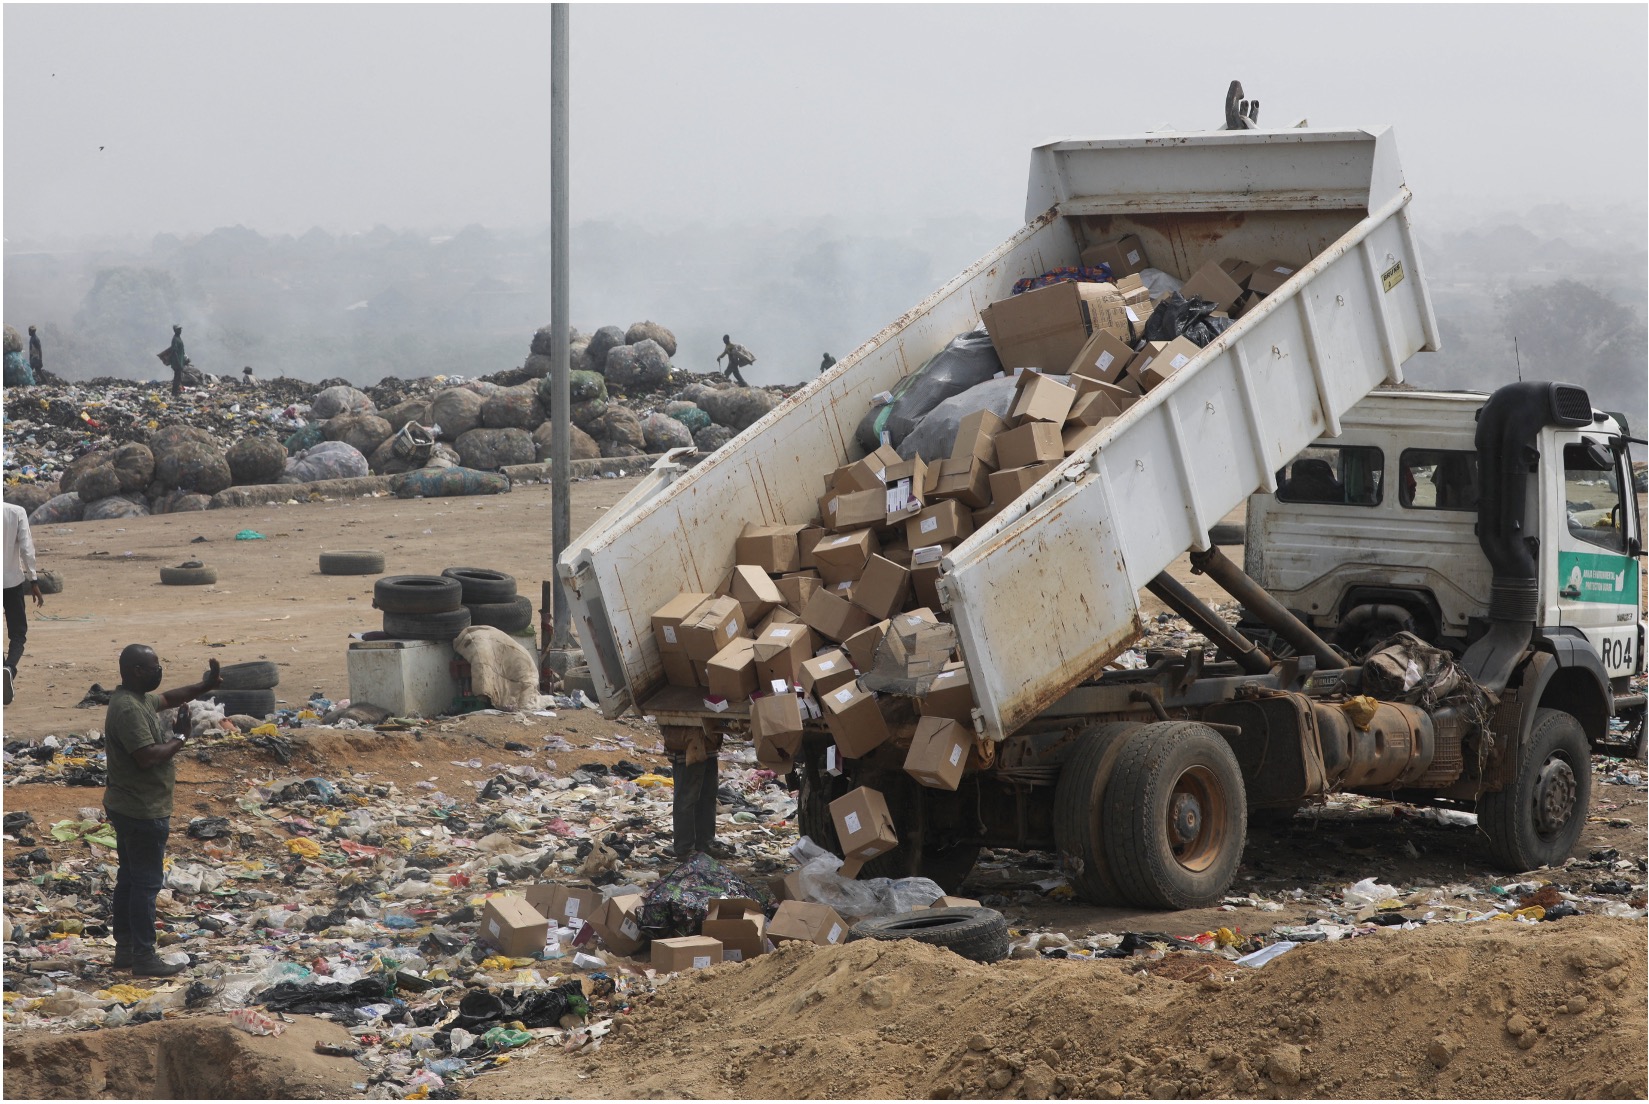
The Immunisation Supply Chain
Outline
- Immunisation Supply Chain
- (Forecasting) Problem
- Methodology
- Model Performance Evaluation
- Way Forward
Vaccines
Vial

Dose
Administered
Wastage
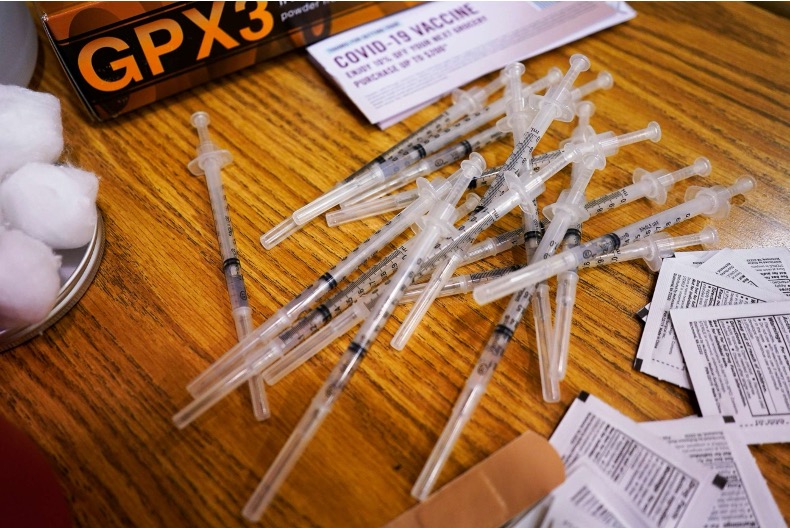
Open Vial
Closed Vial
What we want to achieve?

High Coverage of the Doses Administrated
✅ Reduce missed opportunities
✅ Accounting for accurate wastage rate
✅ Data-driven buffer stock
✅ Forecasting + inventory integration
Outline
- Immunisation Supply Chain
- (Forecasting) Problem
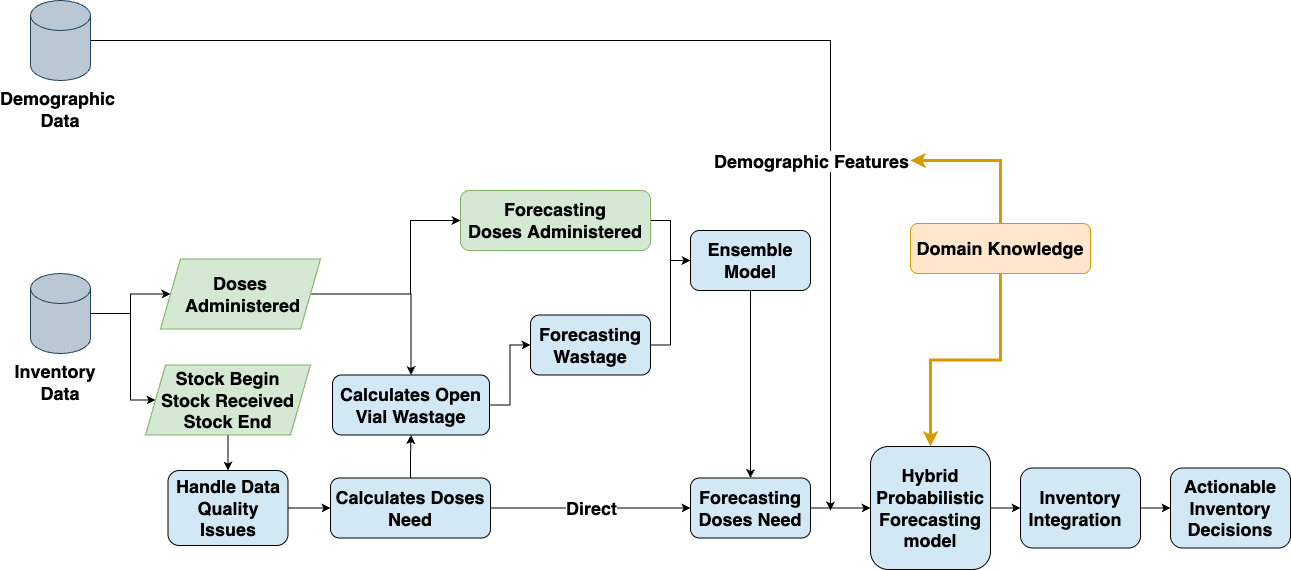
- Methodology
- Model Performance Evaluation
- Way Forward
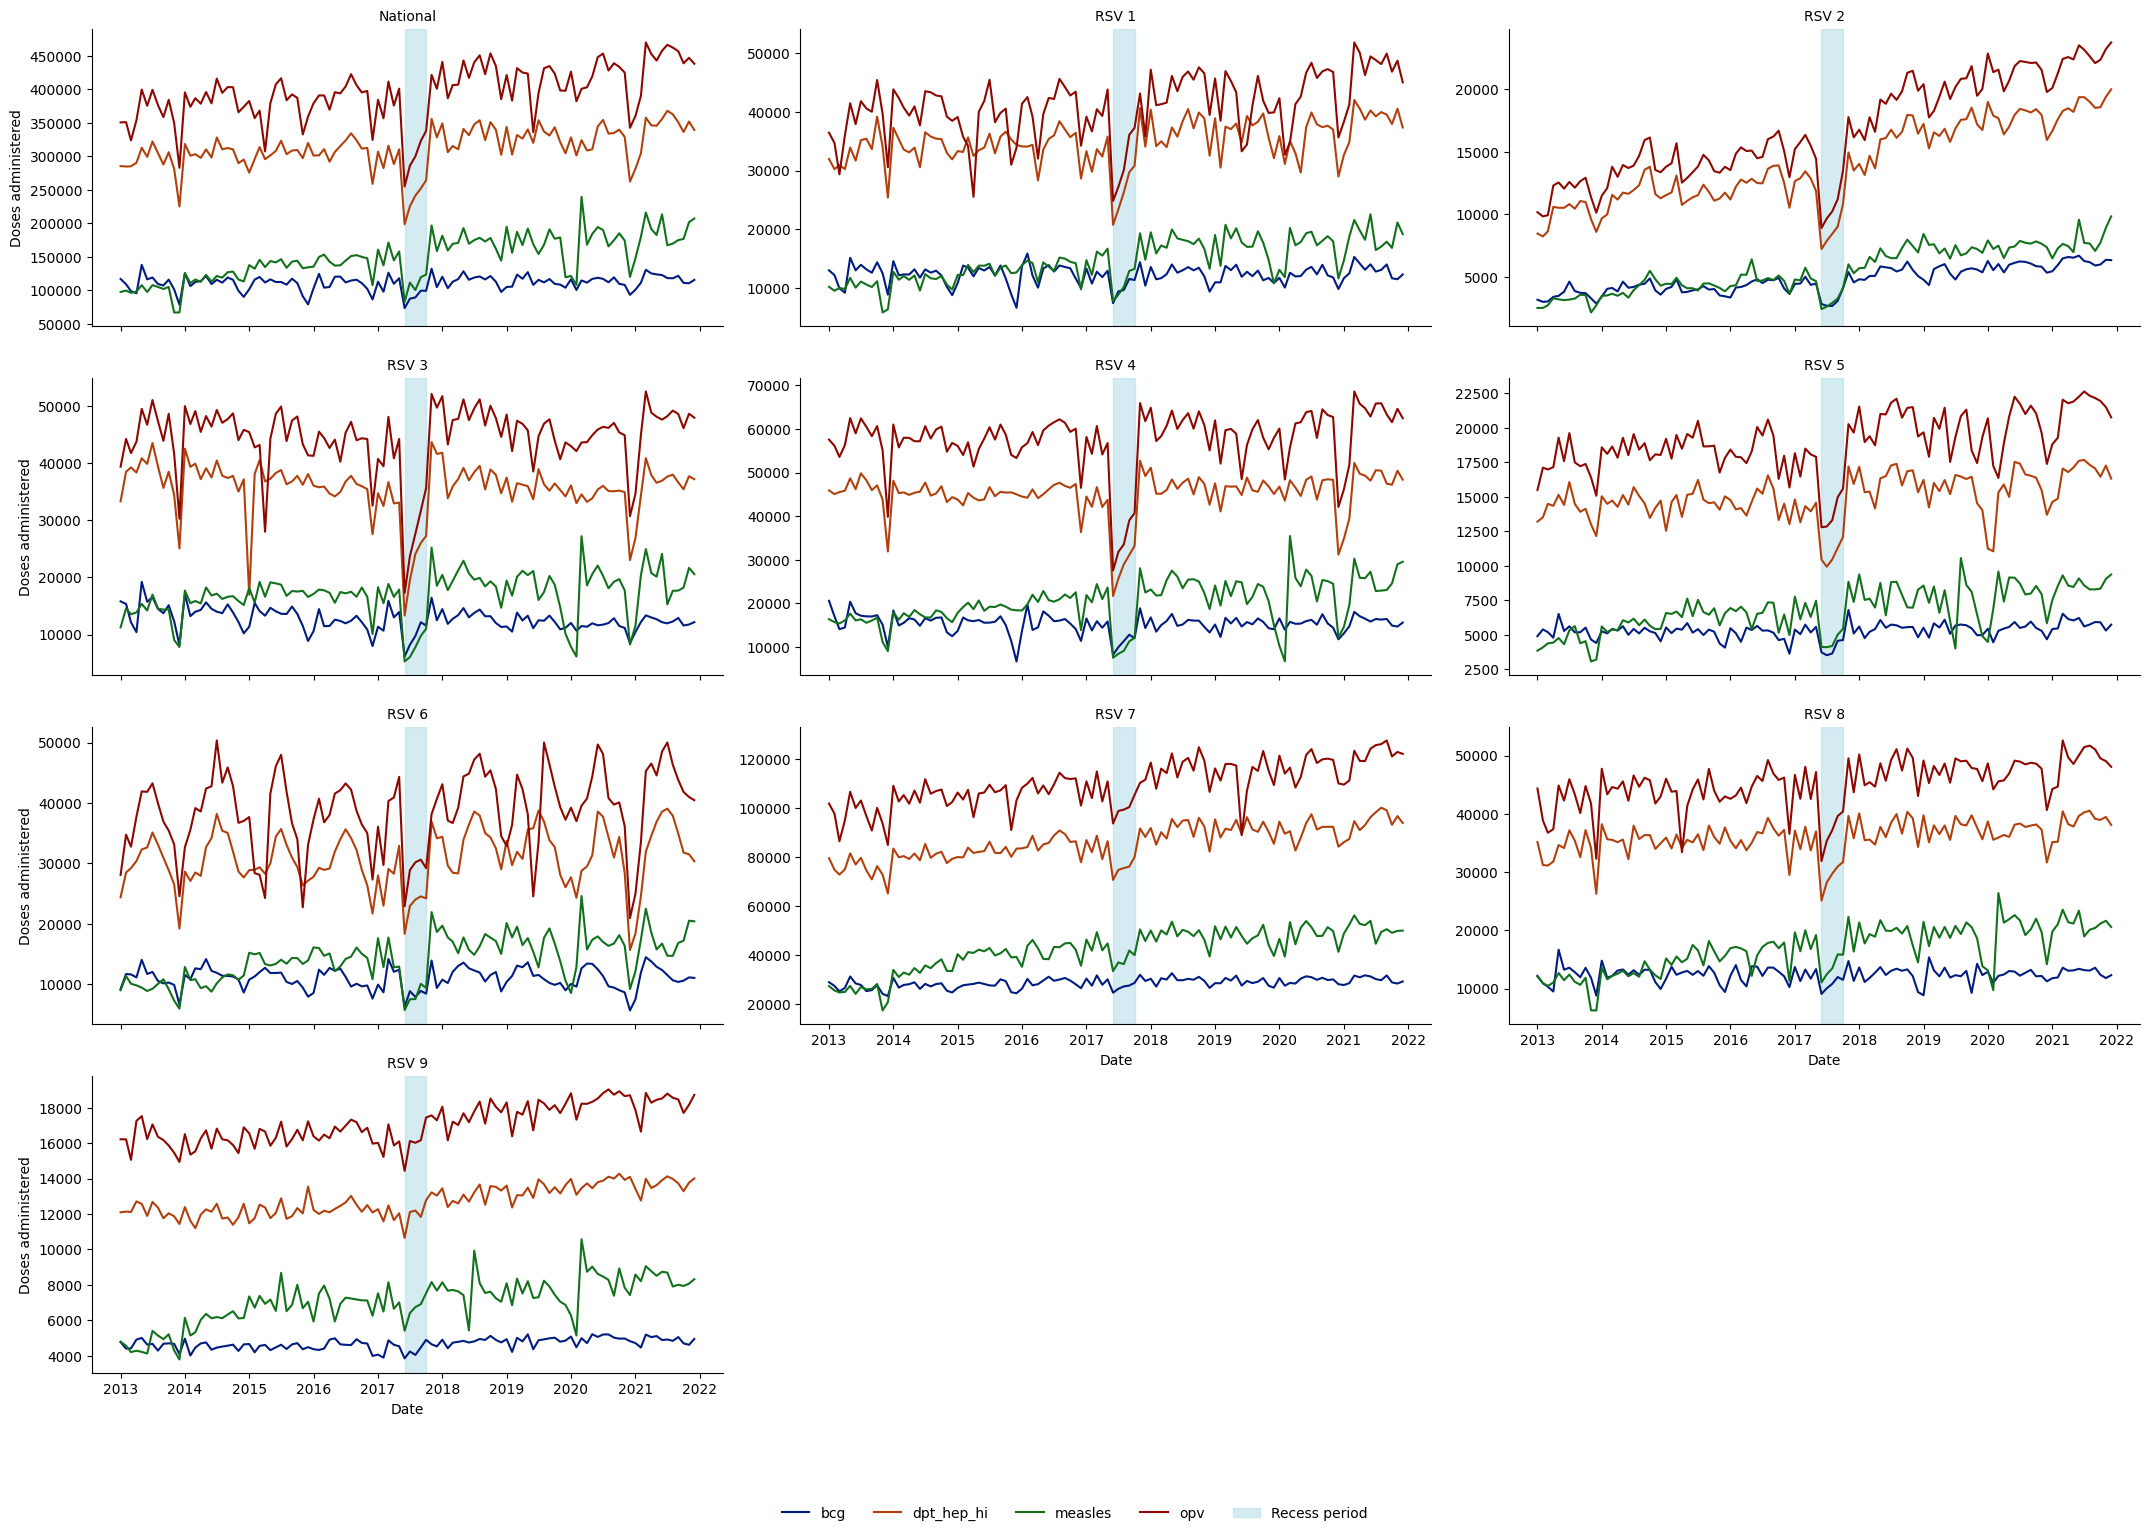
Data Structure
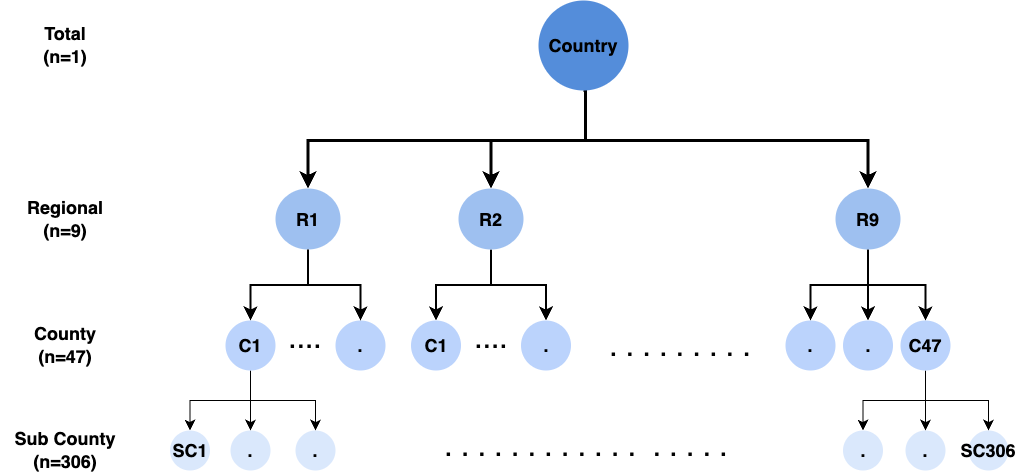
Doses administrated: National and Regional
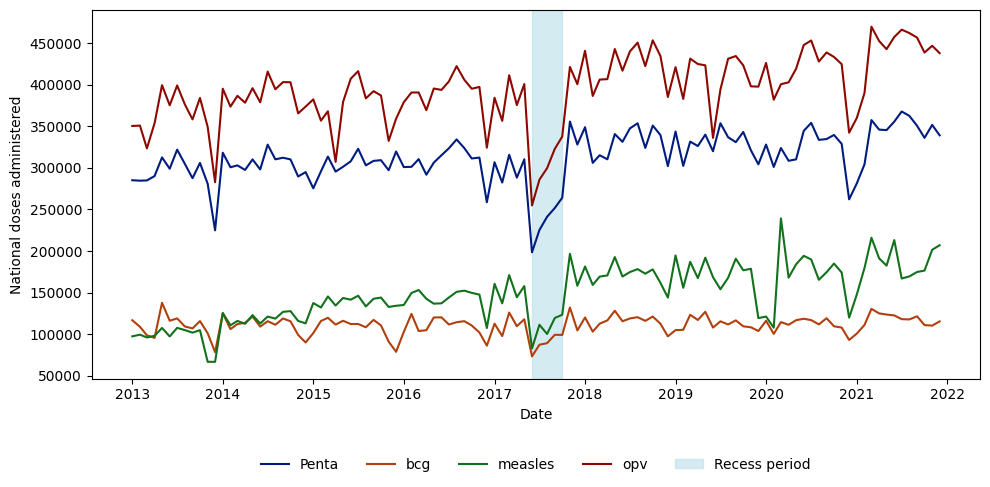
Doses administrated: National
Outline
- Immunisation Supply Chain
- (Forecasting) Problem
- Methodology
- Model Performance Evaluation
- Way Forward
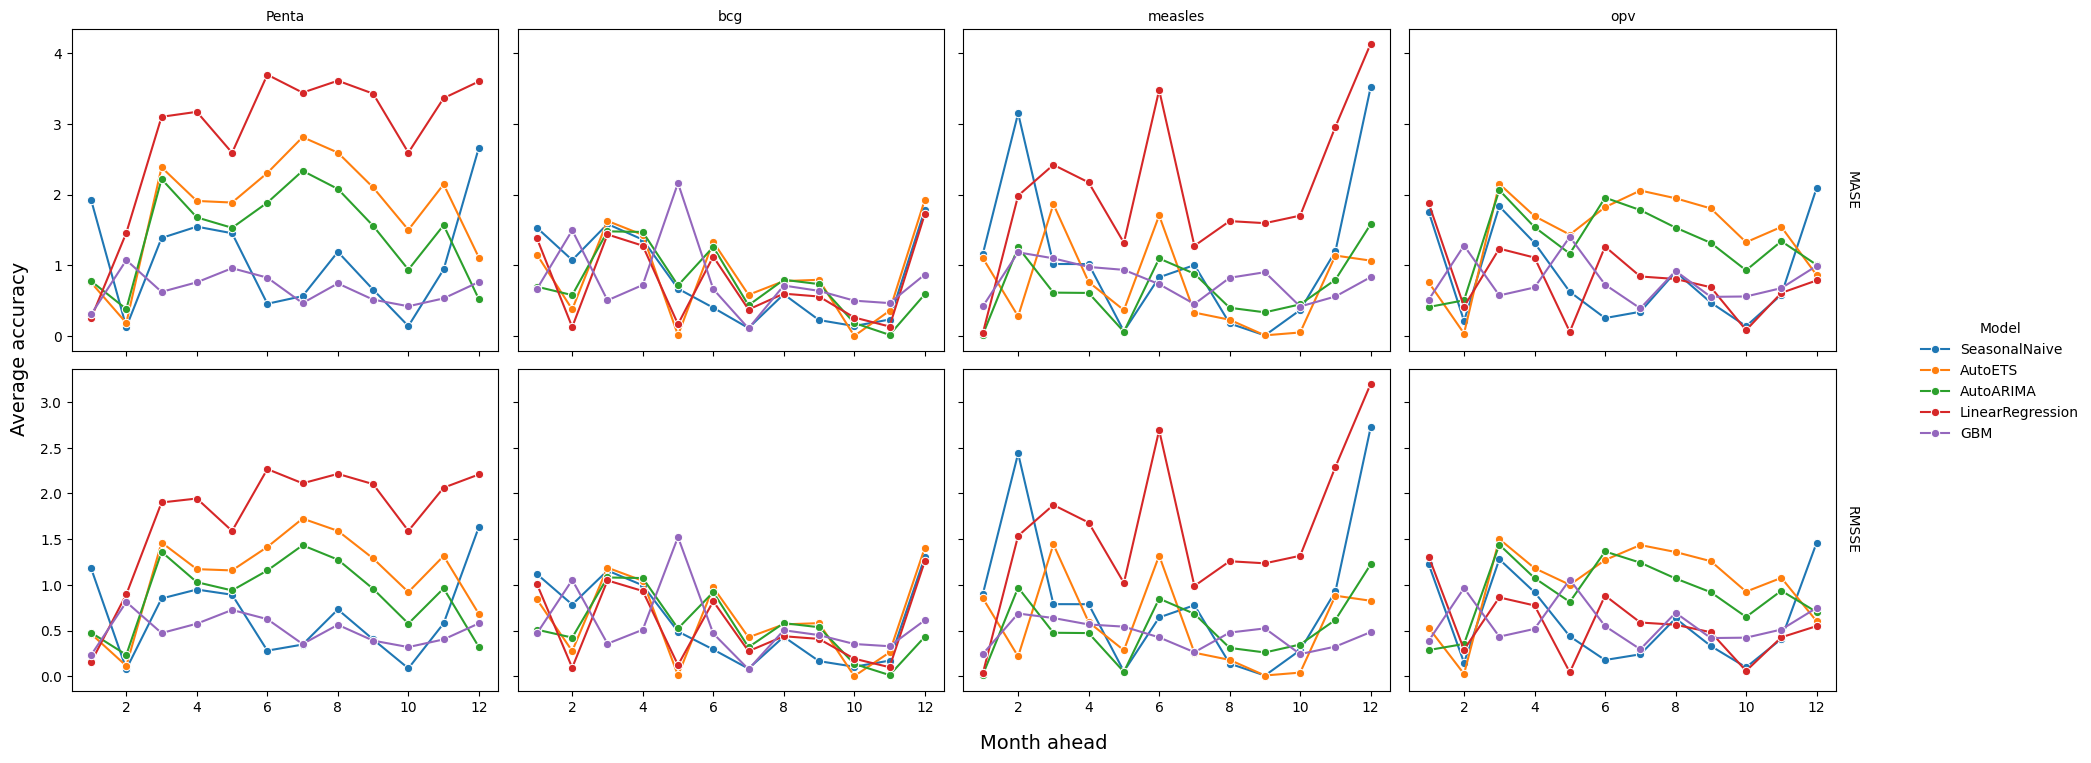
Model Performance Over Forecast Horizon
Outline
- Immunisation Supply Chain
- (Forecasting) Problem
- Methodology
- Model Performance Evaluation
- Way Forward
Next Steps

Acknowledgement
- John and Snow Inc (JSI) team
- Dr. Laila Akhlaghi
- Wendy Prosser